
Median sale price$580,000Across priced portfolio sales
California portfolio
Portfolio Market Analysis
Verified insights from homes bought and sold with Gurmeet.All recorded completed transactions
Coverage updates as portfolio fields are added
Average price / sq ft$452Homes with price and size data
Homes sold204Completed portfolio transactions
Total sales volume$135,236,020203 recorded sale prices
Average home size1,641.74 sq ftHomes with square footage
Portfolio trend
Annual sales performance
Homes soldAverage price
View chart data
| Year | Homes sold | Average sale price |
|---|---|---|
| 2008 | 4 | $316,250 |
| 2009 | 1 | $275,000 |
| 2010 | 1 | $273,000 |
| 2011 | 6 | $233,417 |
| 2012 | 6 | $272,698 |
| 2013 | 11 | $326,091 |
| 2014 | 10 | $352,000 |
| 2015 | 19 | $547,654 |
| 2016 | 15 | $620,620 |
| 2017 | 9 | $483,361 |
| 2018 | 17 | $734,882 |
| 2019 | 22 | $695,197 |
| 2020 | 13 | $798,315 |
| 2021 | 16 | $933,156 |
| 2022 | 16 | $937,094 |
| 2023 | 9 | $1,004,154 |
| 2024 | 9 | $790,444 |
| 2025 | 10 | $938,755 |
| 2026 | 7 | $700,143 |
Portfolio snapshot
Data at a glance
- Priced sales
- 203 of 204
- Recorded sale dates
- 201 of 204
- Cities represented
- 34
- Map locations
- 202
- Approximate city-center locations
- 202
Insights reflect only the completed portfolio records and fields currently available.
Buyer representation
Bought homes by city
Top eight cities, with remaining buyer transactions grouped as Others.
Union City28 18%
Fremont21 13%
Hayward19 12%
Tracy19 12%
Newark9 6%
San Jose9 6%
Manteca7 4%
Dublin6 4%
Others40 25%
View chart data
| City | Homes bought | Share |
|---|---|---|
| Union City | 28 | 18% |
| Fremont | 21 | 13% |
| Hayward | 19 | 12% |
| Tracy | 19 | 12% |
| Newark | 9 | 6% |
| San Jose | 9 | 6% |
| Manteca | 7 | 4% |
| Dublin | 6 | 4% |
| Others | 40 | 25% |
Property profile
Portfolio home characteristics
Average beds3.22
Average baths2.25
Average size1,641.74 sq ft
Calculated only from records where the corresponding property detail is available.
Recent properties
Latest completed transactions
| Property | Location | Sold date | Sale price | View property |
|---|---|---|---|---|
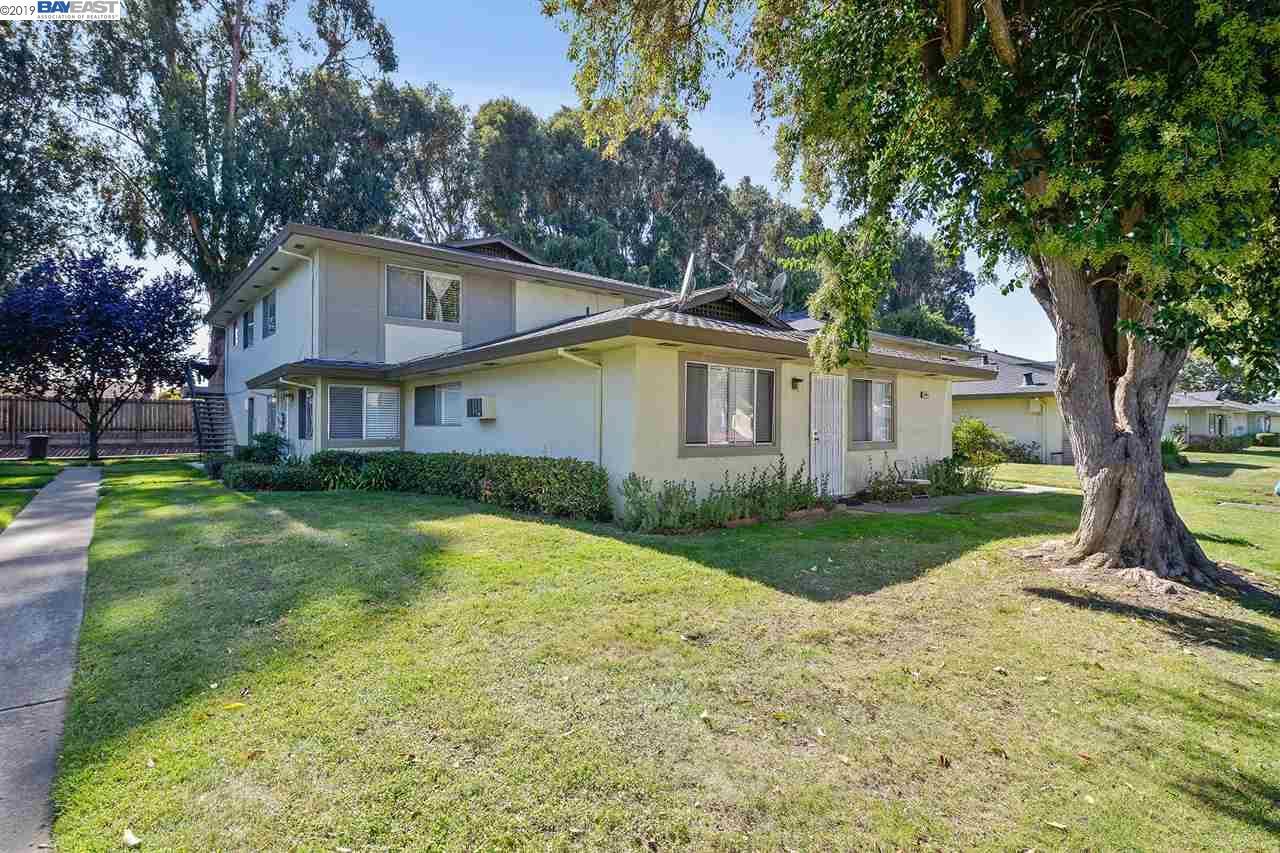 34819 Starling Dr #1 | Union City | Not recorded | $430,000 | View |
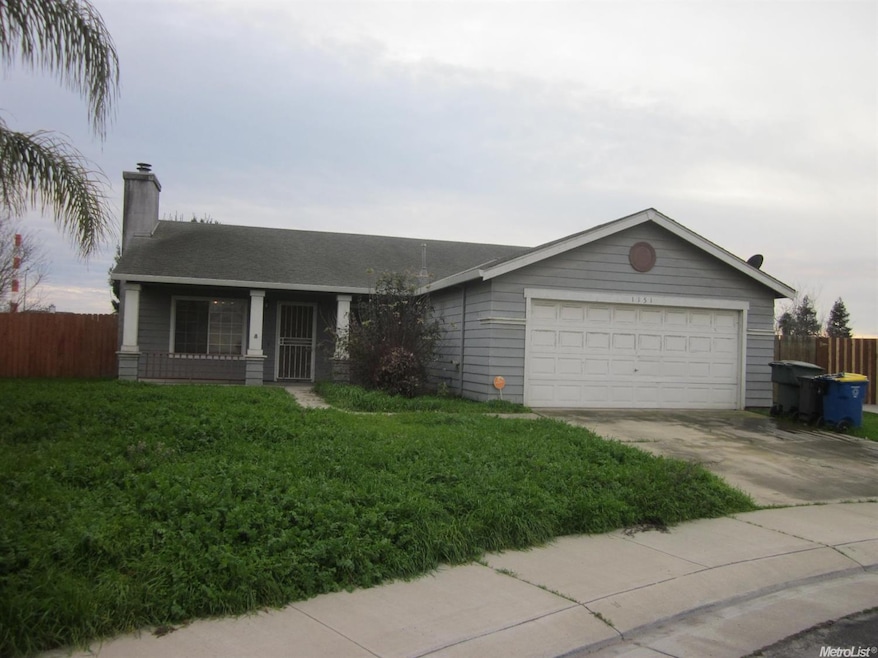 1151 Sherrie Ct | Lathrop | Not recorded | $255,000 | View |
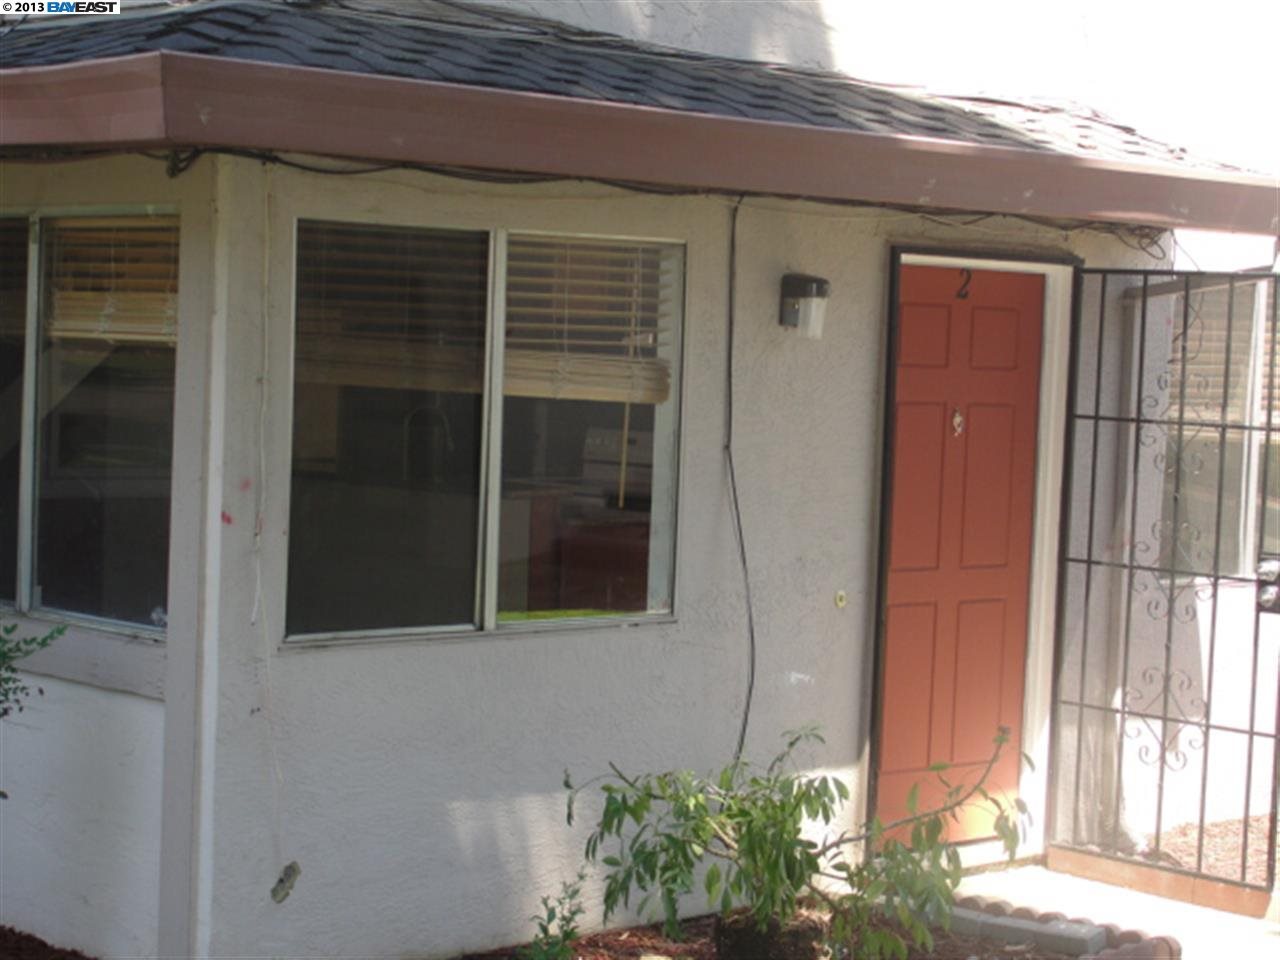 34848 Starling Dr #2 | Union City | Not recorded | Not recorded | View |
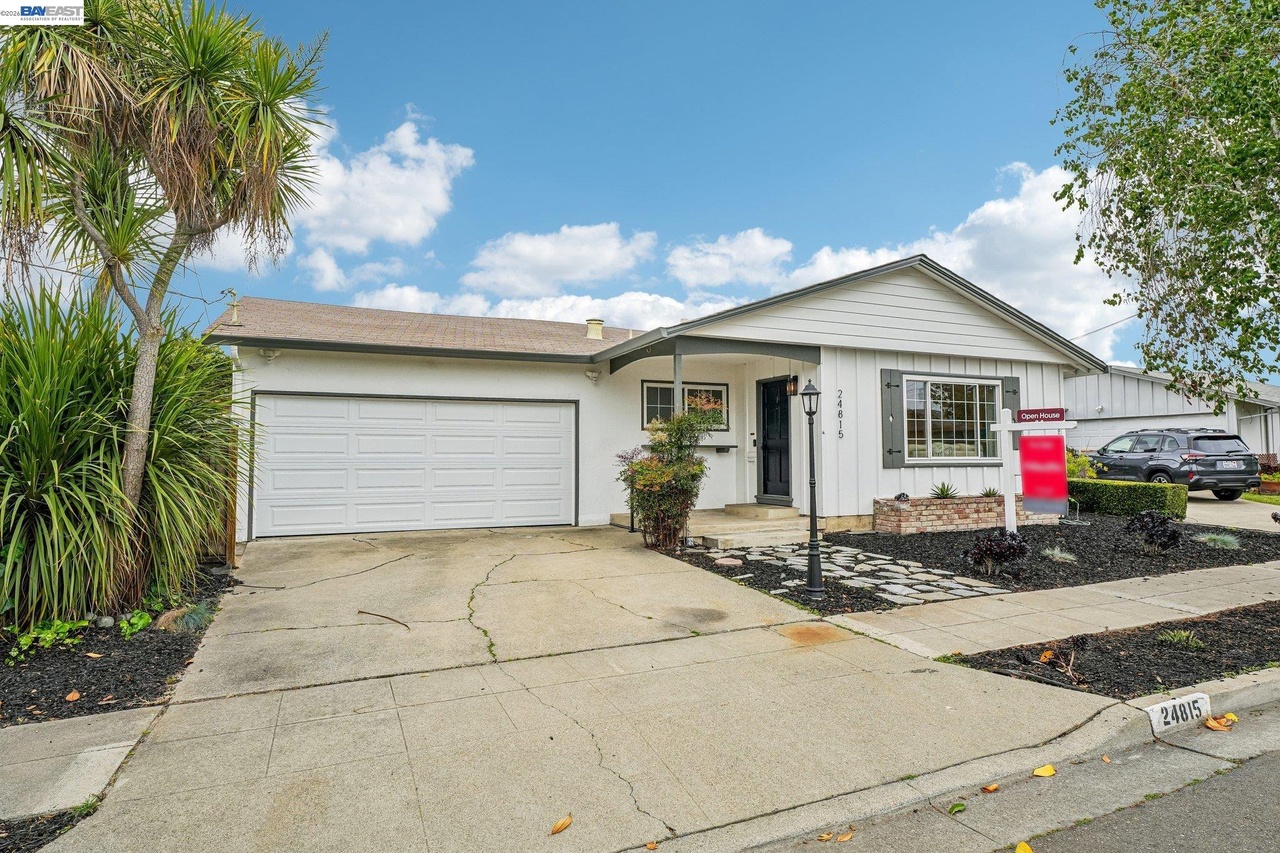 24815 Townsend Ave | Hayward | Jun 16, 2026 | $870,000 | View |
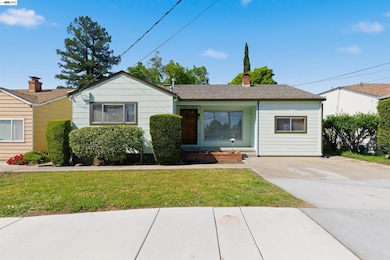 3586 Somerset Ave | Castro Valley | May 29, 2026 | $949,000 | View |
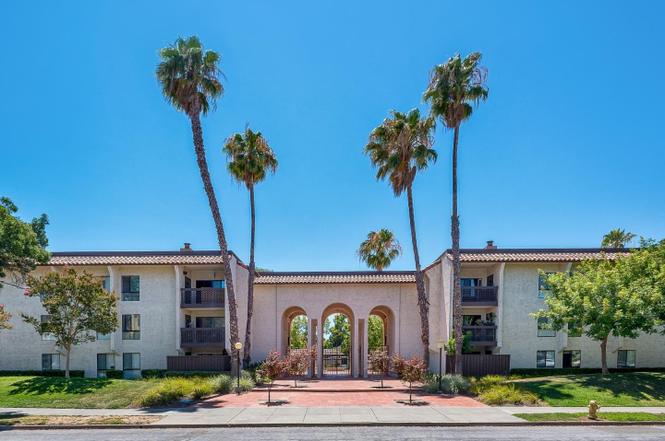 39843 Cedar Blvd Unit 219 | Newark | Apr 28, 2026 | $500,000 | View |
| 39843 Cedar Blvd #219 | Newark | Apr 28, 2026 | $500,000 | View |
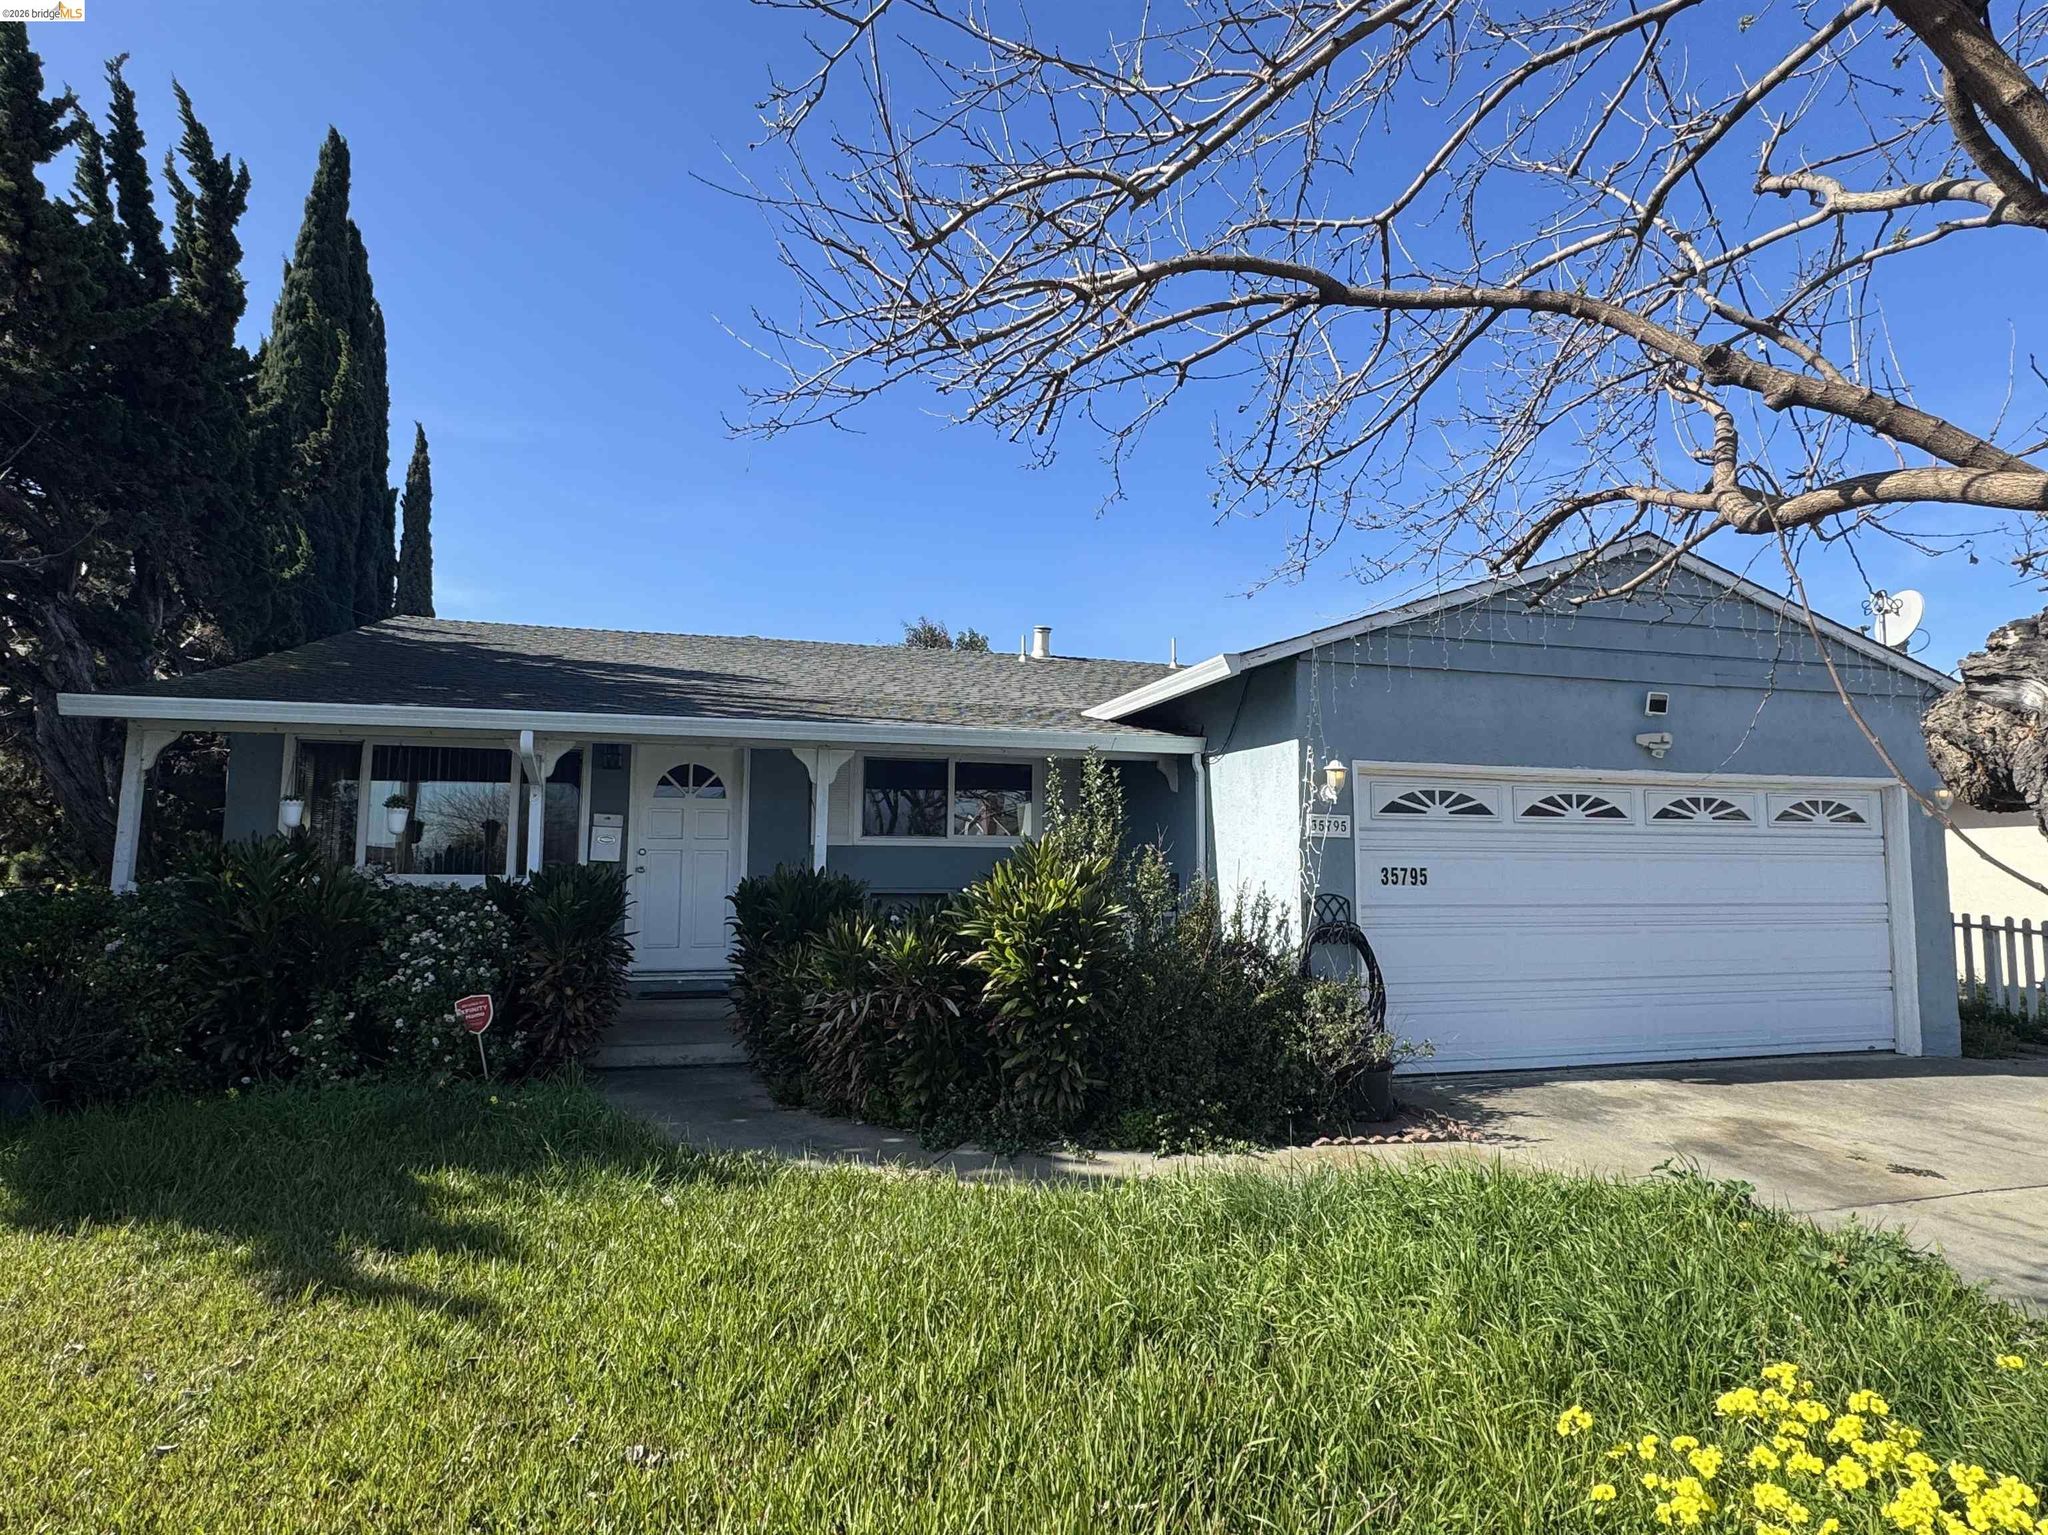 35795 Cabral Dr | Fremont | Apr 21, 2026 | $1,052,000 | View |
Data coverage: prices are recorded for 203 of 204 sold homes; square footage for 198; transaction dates for 201; stored California coordinates for 0 and approximate city-center locations for 202. Unavailable fields are excluded from their metrics.
Private advisory